Pursuant to a Freedom of Information Act request, our law firm acquired ten years of statistics from the U.S. Department of Justice (DOJ) on the filing of qui tam lawsuits under the False Claims Act, broken down by federal judicial district. To our knowledge, this level of detail on qui tam activity previously has not been shared publicly. The statistics cover fiscal years 2008 through 2017 — mostly the Obama years.
In this paper we summarize the DOJ data and combine it with other publicly available information to identify states where qui tam suits have been filed at rates substantially above or below the norm. We offer a ranking of these "hot states" and "dormant states" and examine possible reasons for their status, focusing especially on the role of local U.S. Attorney offices (USAOs).
We conclude that U.S. Attorneys who declare themselves open for business in the qui tam arena attract relators to their districts at much higher rates — particularly when such a declaration is accompanied by outreach to the tight-knit community of qui tam lawyers. We also offer other tentative correlations, and we identify "trending states" that may be headed for "hot" status.
Finally, we invite others to use the same data to explore further the qui tam landscape.
This article by
TELG managing principal R. Scott Oswald was published by The Employment Law Group, P.C. on March 21, 2018.
Top States for Qui Tam Lawsuits
By R. Scott Oswald [1]
Note: This paper is available as a PDF. An Excel spreadsheet with the underlying DOJ data is also available, as is the original DOJ document. Copyright © 2018 by The Employment Law Group, P.C.
Venue is an important consideration in all federal civil actions, but it’s uniquely important in qui tam lawsuits brought under the federal False Claims Act (FCA), where a whistleblower alleges that the government has been defrauded and sues on behalf of the United States. [2]
Why does venue matter so much for these lawsuits?
Qui tam complaints are filed under seal, and such filings generally trigger a secret investigation that’s directed by the USAO for the federal judicial district where the complaint was filed. [3] As a result, the local USAO has substantial sway over the fate of the complaint and, ultimately, over the size of the whistleblower’s reward, if any. (If a qui tam lawsuit ends in a recovery for taxpayers, the whistleblower is entitled to a share of the proceeds, with some caveats.) [4]
After the USAO investigates, it may opt to throw the government’s full weight behind the case, taking over prosecution (and much of the cost); or to allow the whistleblower, known as a “relator,” to proceed on its behalf while it watches from the sidelines; or to move to dismiss the case entirely, leaving the whistleblower high and dry.
The USAO’s decision will depend, in part, on several factors beyond the merits of the complaint, including the office’s workload, its comfort with certain types of FCA cases, and even its relationship with the law firm representing the relator. [5] Since qui tam cases typically are pursued on a contingency basis — making them expensive and risky for relator-side law firms — lawyers try to file FCA complaints in a federal district where venue is proper and where their client’s cause is most likely to be embraced.
Despite such considerations, many whistleblower law firms have an understanding of the national qui tam landscape that’s sketchy and anecdotal at best. They deal regularly with USAOs in the districts closest to their location(s), and in a few other districts where they’ve filed or defended important cases, and they may know some more districts by reputation — but there are still dozens of offices about which they know virtually nothing.
After all, there are more than 90 judicial districts nationwide.
In late 2017, seeking a fuller picture of the national scene, The Employment Law Group, P.C., filed a Freedom of Information Act request with the U.S. Department of Justice. We asked for district-by-district statistics on qui tam lawsuits brought over the past ten years, and were pleased to get a prompt response. Although these statistics are available within the DOJ, we don’t believe they’re typically shared with the public.
This paper will analyze the DOJ’s data in order to identify and rank hubs of qui tam activity — and to see what can be deduced from such rankings.
I. RAW DISTRICT-BY-DISTRICT STATS
The most obvious lesson from our raw DOJ data is that qui tam lawsuits are heavily concentrated in a relative handful of federal districts. Over the past five years, the top 15 of 93 districts snagged about half of all such cases nationwide, with California, New York, and Florida each contributing two districts to the Top 15. (See Table 1.)
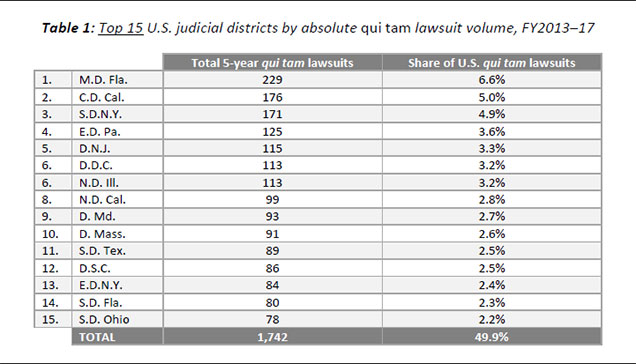
Perhaps surprisingly, the Middle District of Florida (M.D. Fla.) was the clear qui tam leader during this period, with 30% more filings than its closest rival — a contrast to the prior five-year stretch, when it was nip-and-tuck with the Central District of California (C.D. Cal.) and the District of Columbia (D.D.C.). Driven largely by the focus of now-departed U.S. Attorney Lee Bentley, M.D. Fla. also notched the largest absolute increase in qui tam lawsuits compared to the prior five years, followed closely by the Southern District of New York (S.D.N.Y.).
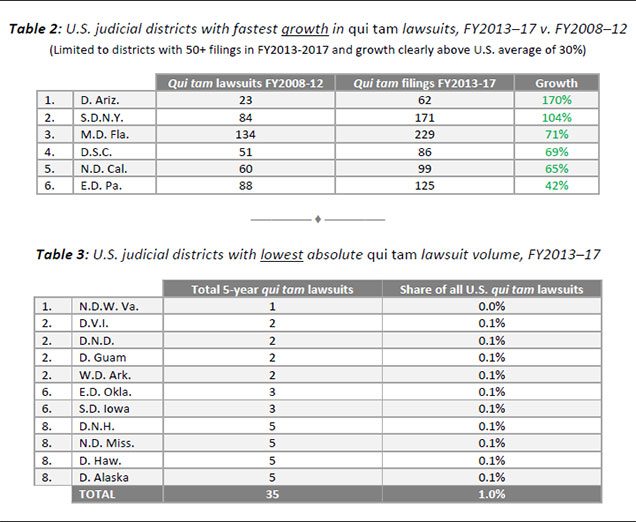
Other districts with fast-growing qui tam dockets included the District of Arizona (D. Ariz.), which almost tripled its filings compared to the prior five years, and the District of South Carolina (D.S.C.), which doubled its filings. (See Table 2.) Meanwhile, important districts going in the opposite direction included D.D.C., whose still-considerable qui tam filings dropped by 15%; the District of Massachusetts (D. Mass.), which fell by 14%; and the Southern District of Florida (S.D. Fla.), which fell by 13%.
Plenty of districts had virtually no qui tam activity at all: From FY2008 through FY2017, 12 districts saw an average of one or fewer cases per year, with the District of North Dakota (D.N.D.) having the smallest ten-year tally among the 50 states plus D.C. — just three qui tam lawsuits. The Northern District of West Virginia (N.D.W. Va.) had only four cases during the same decade, with just a solitary case filed in the five years ended in FY2017. (See Table 3 for data.) Seventeen additional districts had 20 or fewer qui tam cases in ten years; that’s two or fewer filings per year, on average.
What these raw district-by-district statistics don’t tell us, however, is whether any particular district’s qui tam filing rate is high or low as compared to an average or “normal” level. How might we devise such a yardstick, which could help to identify areas where taxpayers may be defrauded with relative impunity — or to draw lessons from areas where prosecution is suitably vigorous?
Certainly we expect the absolute number of qui tam cases to be lower in, say, rural Wyoming than in a metropolitan area such as S.D.N.Y., which includes Manhattan. But what’s a proper level for each? As a prelude to addressing such questions, we first rolled the DOJ’s district-by-district stats up to the state level (including D.C.), since any non-judicial data that might help us to gauge qui tam levels isn’t easily tabulated by judicial district.
Predictably, the largest states bubbled to the top. The top ten qui tam states remained fairly consistent across our decade of statistics, as FCA filings rose in most places. California was a steady leader. Pennsylvania and Georgia gained in rank during the second five years, while D.C. and Massachusetts dropped over the same span — the latter being replaced by Ohio on the leaderboard. (See Table 4.)
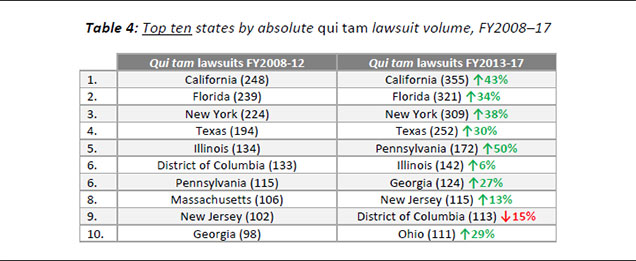
The states with lowest qui tam volume were largely as expected, too. Almost without exception each consisted of a single, low-volume judicial district, with North Dakota and Hawaii at the rear. The lowest-volume states with multiple judicial districts included West Virginia, Iowa, and Arkansas.
With the DOJ data in friendlier form, we considered how to move beyond raw statistics.
II. TOWARD A YARDSTICK FOR QUI TAM LAWSUITS
To address the obvious: There’s no bulletproof way to estimate a “proper” level of qui tam lawsuits for any state — which anyhow should be framed as a forgiving range. Every FCA lawsuit is a highly individual, fact-dependent affair, and even the biggest states see only a few dozen of these filings each year. Annual fluctuations are natural and don’t demand explanation, while conclusions based on small numbers can be treacherous.
That said, qui tam law remains a rational exercise — in the aggregate and over the long run, at least — and should be amenable to rough modeling based on a full decade’s worth of national data. To guide our analysis, we relied on two rules of thumb that we believe ought to be valid:
- All things being equal, a state that receives more federal spending — of all sorts, including social programs such as Medicare — should experience more fraud against that same spending, which should lead to more qui tam lawsuits; and
- All things being equal, a more populous state should contain more whistleblowers who may witness frauds on the government, which should lead to more qui tam actions.
These correlations can be debated, are somewhat entangled, and don’t capture the entire picture. They certainly don’t add up to a mathematical formula. Still, they are measurable and each bespeaks a baseline potential for qui tam lawsuits. This led us to a couple of statistics for which we could calculate a nationwide level — benchmarks against which we might gauge state-by-state performance.
First, we calculated the number of qui tam cases filed per $100 billion in federal spending. The ten-year rate for 50 states plus D.C. is 21.5 cases, with a median of 17.7 cases. [6]
And second, we calculated the number of qui tam cases filed per 1 million state residents. The ten-year rate for 50 states plus D.C. is 19.4 cases, with a median of 15.7 cases. [7]
A state that measures significantly above the national rate on either statistic for a complete decade, we think, is a state where qui tam litigation has become a relatively effective tool for identifying fraud, at least compared to other states. (We’re agnostic on the “right” level for either statistic — although our experience as relator’s counsel tells us that even some of the highest-ranking states have room to grow.)
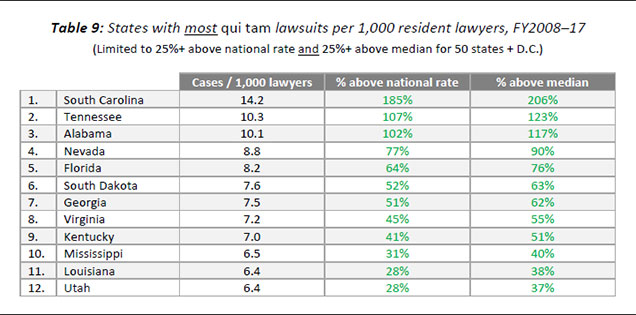
For a further comparison point, we calculated the number of qui tam cases filed per 1,000 resident lawyers. The ten-year rate for 50 states plus D.C. is 5.0 cases, with a median of 4.6 cases. [8] This is a different sort of benchmark, since the national rate likely indicates an equilibrium for qui tam caseloads. A state with a rate that’s significantly above this equilibrium — South Carolina triples the median rate, for example — is likely attracting a lot of qui tam filings from out-of-state attorneys and/or has an unusually active qui tam bar.
Since each of our statistics tells only part of the story, we combined them to triangulate the top qui tam states for the past ten years. If a state’s numbers were significantly above the norm [9] on both of our benchmarks for effective pursuit of fraud — filings per federal dollar and filings per capita — we called it a “hot state” for qui tam actions. If the state also showed a disproportionately high per-lawyer caseload, then we guessed that its status was driven, at least in part, by out-of-state law firms and/or local firms that attract out-of-state relators.
By the same token, if a state measured well below [10] its peers on both of our main stats, we would call it a “dormant state” — and we would be surprised to see much interest from out-of-state firms. Such dormant states, however, might harbor potential for future development.
Before we identified these hot states and dormant states, however, we looked at each of our statistics on a standalone basis.
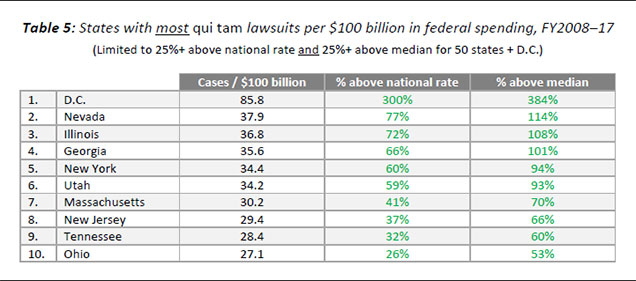
For qui tam cases per federal dollar spent, we saw a clear outlier at each end of the scale. At the top end, Washington, D.C. obviously attracts qui tam lawsuits for reasons well beyond the raw federal money that’s spent in the district: At 86 cases per $100 billion in spending, its filing rate was more than double the nearest competitor, Nevada, and quadrupled the national rate. From Nevada downward there was a much smoother progression, indicating differences of degree rather than kind. (See Table 5.)
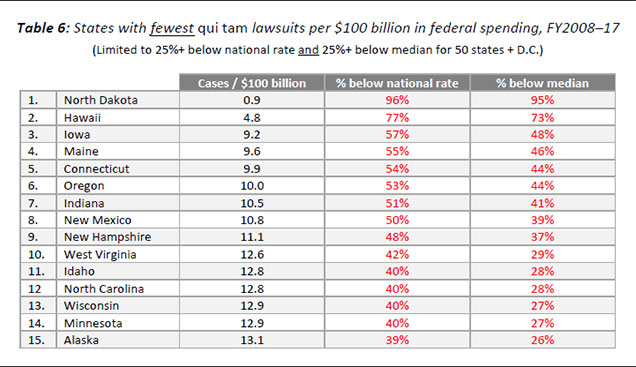
North Dakota was a similar outlier on the opposite end. At just 1 case per $100 billion in spending, its ten-year filing rate was less than a fifth of the next-lowest state, Hawaii, and less than a twentieth of the national rate. Comparisons are less reliable here, since numbers are minuscule, but the gap was striking. Meanwhile, number-two Hawaii’s rate was half that of Iowa, the next state — after which the differences became much less stark. (See Table 6.)
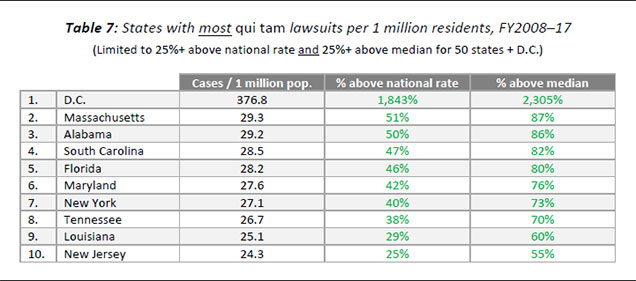
D.C. was even more of an outlier on per-capita filings, eclipsing the 50 states by more than an order of magnitude; clearly its outsize filing rate is mostly unconnected to resident whistleblowers. Setting aside D.C., per-capita filing rates peaked at around 50% above the national rate, in Massachusetts and Alabama, and declined smoothly from there. (See Table 7.)
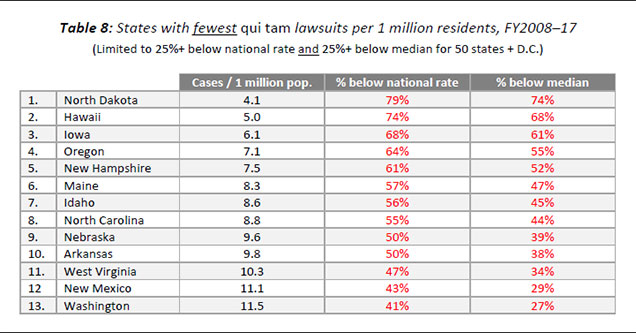
Among states with low per-capita filing rates, meanwhile, North Dakota was again at the bottom, again followed by Hawaii. This time no state was a clear outlier. (See Table 8.)
When it came to high per-lawyer qui tam lawsuit rates, we saw some states that weren’t on any other lists — South Dakota, for instance. Such states still showed “underfiling” compared to their active peers, but may have piqued the interest of non-resident lawyers. (See Table 9.)
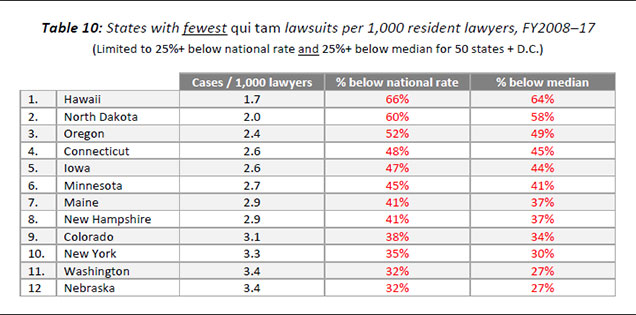
Finally, the states with lowest per-lawyer filing rates were mostly a familiar bunch — but surprisingly included New York, which was on the top lists for our other measures. The simplest explanation here is that New York has the country’s largest population of lawyers and is, at least with regard to its sizable docket of qui tam cases, overlawyered. (See Table 10.)
Our individual components now in hand, we proceeded to combine them.
III. OUR RANKING OF HOT, DORMANT, AND TRENDING STATES
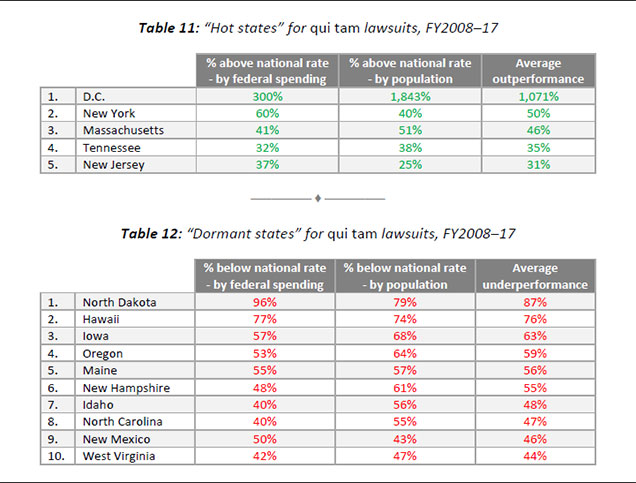
To recap, our working definition of a “hot state” is a state that, over the past decade, substantially outran its peers in qui tam lawsuits per federal dollar and in qui tam lawsuits per capita. Only four states, along with D.C., met this standard.
Putting our hot states in rank order isn’t an exact science — except for giving D.C. the number-one spot, a no-brainer because of its outlier status. We settled on calculating the average percentage by which each state outpaced the national rate on both of our measures, which gave us New York as a runner-up and Massachusetts in bronze position. (See Table 11.)
Similarly, a “dormant state” is a state that substantially underperformed its peers on both measures during the same period. We found ten such states, with North Dakota as the laggard. We ranked these in the same way as hot states — although it’s worth repeating that our scrutiny of low performers may be unreliable, given the low numbers. (See Table 12.)
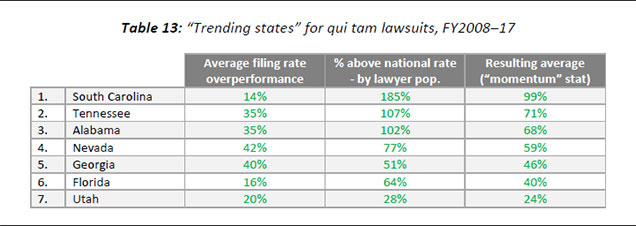
We also thought it worthwhile to identify “trending” states that didn’t yet qualify as hot states but that still ranked well above their peers for either filings per federal dollar or filings per capita — indicating healthy qui tam activity — and also showed themselves to be attracting national attention via a high per-lawyer caseload. All things being equal, we believe, qui tam rates in these states should continue to grow until they approach the levels of a mature hot state such as New York.
We found six such trending states — to which we added Tennessee, which also met our “trending” standard even after hitting hot status. To rank our trending states, we took the average outperformance statistic we had used for hot states and combined it with the percentage by which these up-and-comers outperformed in per-lawyer filings. The average of these two numbers is a reasonable proxy for qui tam filing momentum over the past decade, we believe. The resulting number-one rank for South Carolina was no surprise, given the efforts of former U.S. Attorney Bill Nettles to evangelize his district as a mecca for qui tam filers. (See Table 13.)
The opposite of qui tam momentum is inertia: A filing rate that’s already low and shows no sign of attracting new lawyer interest. Of our ten dormant states in Table 12, above, the first six — from North Dakota through New Hampshire — also had per-lawyer caseloads that were well below average. Without a shove, perhaps from new U.S. Attorneys, we think they’re unlikely to grow much in the short run. The same is true for states such as Connecticut, which ranks low on just one of our core measures (filings per federal dollar) but also has a per-lawyer caseload that’s half the national rate. We didn’t tabulate such non-trending locales, since they didn’t add much to our understanding.
So what lessons may we draw from our state rankings?
For one thing, a state’s raw volume of qui tam lawsuits may be important — a high rate means, for instance, that local USAOs must be intimate with the False Claims Act — but it doesn’t necessarily translate to vigorous prosecutorial interest. Several states with high qui tam volume failed to rank as hot states or as trending states, according to our measures: California, Texas, and Illinois, for instance, clearly could be busier.
For another, the mere existence of one or more Affirmative Civil Enforcement (ACE) units — USAO resources that are dedicated to pursuing qui tam and other affirmative cases — doesn’t guarantee that a state will have a vigorous qui tam regime. USAOs in several dormant states, including North Dakota, Oregon, and Maine, boast an ACE unit. [11]
One factor that’s likely holding back some of these dormant states: Unless an FCA defendant is based there, it may be a stretch to establish legal venue in states that are far-flung, like Hawaii, and/or sparsely populated, like North Dakota and Maine. Another factor, even if venue could be proper and a friendly ACE unit beckons: National-level qui tam firms are less likely to have established relationships with local counsel in such states. Neither of these factors is fatal, however — Utah was a “trending” state, for instance — and neither explains the dormancy of a state such as North Carolina.
Looking at all of our rankings, we concluded that the best correlator of a healthy qui tam action rate is a U.S. Attorney who sells his or her district as a welcoming venue for relators and their cases — ideally in an easily accessible state. Exhibit #1 is Lee Bentley, previously mentioned as the former U.S. Attorney for M.D. Fla., the leading judicial district for qui tam lawsuits from FY2013–17. Mr. Bentley is perhaps the single largest reason for Florida’s status as a trending qui tam venue, which he sealed by attending numerous qui tam conferences and promising strong investigative support and a generous relator’s share to successful whistleblowers.
Similar stories can be told about Bill Nettles in South Carolina; Preet Bharara in S.D.N.Y., whose district drove statewide qui tam increases; Daniel Bogden in Nevada; Paul Fishman in New Jersey; and others. The impact of activist U.S. Attorneys over the past decade is made plain by the DOJ’s year-by-year filing statistics.
In a few cases, a state’s ten-year ranking was earned over a shorter interim period — but again, such spikes aligned with concerted pushes by individual U.S. Attorneys. In Tennessee, for instance, qui tam cases surged in FY2011–13, matching the tenure of Jerry Martin in the state’s Middle District. Cases in Utah peaked similarly during the stint of David Barlow, who left office in 2015.
Even where a long-serving U.S. Attorney oversaw both increases and declines in qui tam filings, there’s usually a ready explanation. In Massachusetts, for instance, filings rose sharply after the arrival of Carmen Ortiz — but then dropped again after FY2013. As many practitioners know, this coincided with a tactical switch by Ms. Ortiz’s office to focus its assistance on qui tam cases with larger dollar values.
Still other states have remained steadily busy under a succession of qui tam-friendly U.S. Attorneys. Alabama’s status as a “trending” state, for example, was built mostly in its Northern District, where the proactivity of Alice Martin — an appointee of George W. Bush — was followed by Obama appointee Joyce White Vance, with continuity into the tenure of Jay Town ensured by ACE Coordinator Don Long.
Another factor that’s notable in Alabama: The presence of Beasley Allen, a national-scale qui tam law firm in a relatively small state. There’s a similar dynamic in Georgia, where several notable qui tam firms are based in Atlanta, including Wilbanks & Gouinlock.
Finally there’s the special case of the District of Columbia, the locale with the highest qui tam lawsuit rates by far. The USAO in D.D.C. is sui generis, heavily staffed and deeply connected with many federal agencies for which it investigates non-qui tam FCA actions. As such it’s the obvious choice for a large number of qui tam lawsuits, too, especially in areas such as procurement fraud, a practice area that involves federal dollars from areas far beyond D.C.’s borders. The office has developed a special relationship with the General Services Administration, which builds and manages federal facilities nationwide.
Another factor: D.C. has a truly extraordinary concentration of lawyers, and is home to many national-level qui tam firms. That’s why, despite its sky-high filing rates, D.C. is only average in its per-lawyer caseload.
IV. FINAL THOUGHTS — AND AN INVITATION
While we hope our peers find it engaging, this brief analysis of qui tam lawsuit rates surely omits some important factors. What’s more, its backward-looking characterizations may limit its predictive value: With the Trump administration’s purge of U.S. Attorneys in 2017, a new crop of prosecutors is reviewing each district’s posture toward qui tam relators — and as we have seen, filing rates are heavily swayed by such personality-driven decisions.
Changes in DOJ policy and in qui tam case law, too, loom large. In 2018, the ground on which qui tam lawyers stand is mushier than it was five years ago, when annual filings peaked at more than 750 nationwide. We expect that many new U.S. Attorneys will promote a “retreat to quality” — fewer, stronger qui tam cases, even in districts that previously cast a wider net.
Nonetheless, we are believers in momentum: Our “hot” and “trending” states will continue to lead the way for years, we think, regardless of regime. And a meritorious qui tam complaint will be embraced by any U.S. Attorney in the land, as always.
What do you think? Would you like to dig further into the DOJ’s per-district statistics for the past decade — to draw your own conclusions, to look more closely at districts we have (or have not) mentioned here, or just to check our math?
We invite you to do so. We’ve put the data in an Excel spreadsheet here.
In the meantime, if you have corrections or other feedback on this paper, please e-mail me at [email protected].
—–
My thanks to Laurence Hooper and Ashleigh College Callaway for their help with this project.
FOOTNOTES
[1] Managing Principal of The Employment Law Group, P.C. Mr. Oswald is a whistleblower attorney who serves as vice chair of the Qui Tam Section of the Federal Bar Association.
[2] Qui tam actions under the FCA are governed by 31 U.S.C. § 3730.
[3] In some larger cases, the investigation may be directed from “main Justice,” the DOJ headquarters in Washington, D.C. For such cases the role of the local USAO is diminished but usually not eliminated.
[4] See 31 U.S.C. § 3730(d).
[5] At the Federal Bar Association’s recent Qui Tam 2018 conference, for example, several Assistant U.S. Attorneys said they give added credence to claims filed by law firms with whom their USAOs have had previous success.
[6] Official year-by-year federal spending numbers are available at USASpending.gov. For this project we took the ten-year spending total for each state, measured from FY2008–17, and compared it to the ten-year total of qui tam lawsuits for that state. We used $100 billion as our denominator so that the resulting ratios would be rendered as 1.0 or better, making them easy to compare at a glance. (We made similar choices for our other denominators in this project — 1 million residents and 1,000 lawyers.) The median rate, as for our other statistics, is the rate for the 26th-ranked state out of 51 (50 + D.C.), here Rhode Island.
[7] Official year-by-year population estimates are available at Census.gov. For this project we took the average population for each state for the eight years from July 1, 2010, through July 1, 2017 — the period since the last national census — and compared it to the ten-year total of qui tam lawsuits for that state.
[8] The American Bar Association produces year-by-year estimates of resident lawyer populations, which it makes available at AmericanBar.org. For this project we took the average of the 2008 and 2017 estimates for each state and compared it to the ten-year total of qui tam lawsuits for that state.
[9] We defined this as at least 25% above the national rate and at least 25% above the rate of the median state.
[10] At least 25% below the national rate and at least 25% below the rate of the median state.
[11] As far as we know, there’s no publicly available listing of ACE units and their current/historical staffing levels by federal judicial district. Our firm compiled some data for this project via Web research and phone outreach, but nothing that was complete and reliable. A FOIA request is a logical next step.